Real-Time Operational Intelligence Hub for Energy Distribution at Scale
Architected a hybrid data engineering platform bridging on-premise Oracle infrastructure with Microsoft Azure, delivering sub-minute operational visibility across a distribution network handling over 4 million barrels per day.

Real-Time Operational Intelligence for Energy Distribution at Scale
Moving fuel across terminals, storage sites, and retail stations requires tight coordination between field logistics and enterprise financial records.
Diamond Professional Consultants works with senior leadership on performance management and business data. When designing their executive briefing center, the Zakaa Innovation Hub, they needed a way to show live operations across a network handling over 4 million barrels of fuel every day.
Zediant worked alongside Diamond to build a hybrid data platform that pulls live updates from legacy Oracle databases into Microsoft Azure, giving leadership instant visibility on large presentation screens.
The Problem: Managing Operations with Outdated Numbers
Before this project, the team relied on batch jobs and manual data pulls that made it hard to spot problems early:
Delayed Stock Numbers
Inventory counts updated once a day overnight. That meant depot imbalances, shortages, and overstocking were often spotted hours after they happened.
Disconnected Data Sources
The enterprise ERP and the on-premise Oracle data warehouse operated separately. Creating management reports required team members to export and reconcile spreadsheets by hand.
Legacy Pipeline Limits
Existing extraction scripts were never built to push data quickly to the cloud. Running heavy queries during working hours slowed down core operational systems.
Six Practical Challenges We Had to Solve
Getting clean numbers onto an executive screen without crashing production systems meant solving six distinct engineering problems:
Fast Data Ingestion
Ingesting continuous transactional logs from field terminals without dropping events or slowing down local operations.
Data Accuracy Between Systems
Making sure the physical fuel movement numbers matched the financial figures recorded in the central ERP.
Protecting the Legacy Database
Pulling fresh updates from the on-premise Oracle warehouse without running heavy full-table queries during peak hours.
Sub-Minute Latency
Trimming the processing steps so that changes in the field appear on the executive screens within 60 seconds.
Responsive Large Displays
Building an interface in React that renders complex charts smoothly on high-resolution multi-screen wall displays.
Access Control and Security
Setting up role-based permissions to ensure sensitive financial and operational figures are only seen by authorized roles.
How the Data Moves: The 5-Layer Setup
We used a hybrid design. The existing on-premise database remains the source of truth, while Microsoft Azure handles the processing and fast display delivery:
Terminal and ERP Systems
Field depots, dispatch tools, and logistics logs capture movements on the ground.
On-Premise Oracle Data Warehouse
Stores transactional history and keeps existing enterprise records intact.
Python and Django Integration Workers
Lightweight workers check for incremental updates and validate records without running slow scans.
Azure API Gateway
Cloud services handle user authentication, secure query caching, and data delivery.
React Executive Dashboard
A fast frontend interface built for large room displays, allowing users to view high-level summaries or open depot-level details.
The Four Stages of the Build
Review and Architecture Design
We mapped out the existing database schemas, spotted bottlenecks, and agreed on target refresh rates and security rules.
Data Pipelines and Interface Development
We wrote the Python extraction scripts, built the cloud API services, and developed the React user interface.
Integration and Number Checking
We ran side-by-side checks against existing reports to make sure the automated numbers matched financial records down to the dollar.
Deployment and Fine-Tuning
We deployed the services to Azure, set up automated monitoring, and tuned database indexes to keep refresh times under a minute.
What Changed for the Business
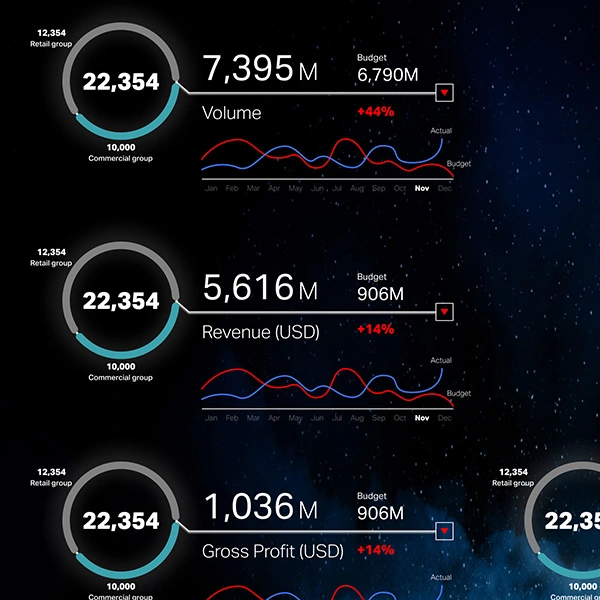
- Visibility in Under a Minute: Instead of waiting for the morning report, leadership can now see depot stock balances update throughout the day.
- Less Time Spent on Spreadsheets: Operations and finance teams cut out roughly 60% to 70% of the manual effort previously spent compiling figures.
- Productive Executive Meetings: Discussions now focus on live operational challenges rather than debating whether last week's numbers are still accurate.
- A Working Demonstration of Capability: Diamond uses the Innovation Hub to show enterprise clients firsthand what modern data architecture looks like in practice.
Why This Mattered to Diamond
Diamond works with senior leaders who make decisions based on trusted data. A dashboard that looked nice but showed delayed or unreliable numbers would have hurt their credibility. Getting the data pipelines right meant their Innovation Hub could become more than just a screen on the wall. It became a living demonstration of the exact data rigor they recommend to their clients.
Ready for Future Additions
Because the platform uses clean APIs rather than fixed reports, it can support upcoming digital initiatives without a rebuild:
Direct Sensor Feeds
Connecting radar tank gauges and depot flowmeters straight into the ingestion layer.
Demand Forecasting
Using historical consumption data to predict terminal shortages 2 to 3 days ahead of time.
Supply Chain Simulation
Testing out alternative truck and pipeline routes when bad weather or maintenance causes delays.
Have a Similar Challenge?
Whether it's real-time reporting, complex integrations, or a platform your team relies on daily - let's talk about what you're building.
Talk to Our Engineering Team